Making Sense of Student Data: A Practical Guide for College Leaders
- Mar 31
- 11 min read
Updated: Apr 3
Colleges have never had more data on their students. The challenge and the opportunity is knowing what it actually means, and what to do next.
Every semester, a college counseling center produces a report. A student affairs office tracks attendance at wellness events. A coaching platform logs sessions. A peer community generates discussion threads. Individually, each of these data points tells a partial story. Together - if interpreted well - they can tell an institution exactly where its students are struggling, what they are seeking, and what kind of support is actually making a difference.
The problem is that most institutions are not set up to connect those dots. Data lives in silos. Reports are produced after the fact. And the administrators who most need to act on the information are often the furthest removed from it.
This piece is written for student success professionals, dean of students offices, counseling directors, and institutional research teams who want to think more clearly about how data - particularly student well-being and engagement data - can become a genuine strategic asset, not just a compliance exercise.
The State of Student Wellness: What the Research Shows
The case for investing in data-informed wellness programs has never been stronger. The evidence base is substantial, and the stakes are high.
37%of college students reported moderate to severe depressive symptoms in 2024–25 Healthy Minds Study, 2024-25 [1] | 68%said mental or emotional difficulties had affected their academic performance in the past month Inside HigherEd / Healthy Minds [2] | 73%of students believe they are more likely to graduate due to the mental health services at their institution TimelyCare Survey, Jan 2025 [3] |
The 2024–25 Healthy Minds Study - conducted across 135 colleges and universities with data from over 84,000 students - shows a promising three-year decline in the most severe symptoms. Yet even as depression and anxiety rates have modestly improved, the proportion of students describing themselves as "flourishing" dropped slightly to 36%, down from 38% the prior year.[1]
Active Minds, the largest youth mental health nonprofit in the United States, has documented a related concern: nearly two-thirds (64.7%) of college students report feeling lonely, and students who describe themselves as lonely are more than four times as likely to experience severe psychological distress.[4] This is not simply a personal issue - it is a retention, completion, and academic performance issue.
"These disparities have been persistent in the last decade of our study, and underscore that there's more work to be done to close the gap in mental health support." - Sasha Zhou, Co-Principal Investigator, Healthy Minds Study (2024–25)
The research is consistent: institutions that invest in student well-being and track outcomes over time see real returns - in persistence, academic performance, and sense of belonging.
Why Most Institutions Struggle to Interpret Their Own Data
The challenge is rarely a lack of data. It is a lack of infrastructure for turning data into understanding.
A decade-long systematic review published in Education and Information Technologies (Springer, 2023) found that while higher education institutions generate enormous volumes of data across learning management systems, student records, and engagement platforms, most existing analytics efforts focus narrowly on academic performance - leaving well-being, belonging, and life skills development largely unmeasured and unmapped.[5]
The same review noted that the most impactful uses of data in higher education involve combining multiple data streams and determining the context - something that is very difficult to do when data lives in separate systems managed by separate teams.
📌 Research Note A 2024 systematic review in Education Sciences found that while data analytics improves student outcomes, a significant barrier is the lack of practical guidance on how to implement and act on analytics - not the data itself. Institutions collect data; the gap is in interpretation and action.[6] |
The University of Connecticut's Success 360 program is a widely cited example of what becomes possible when data is centralized and interpreted well. Administrators use dashboards to identify at-risk students in real time - not just by academic standing, but by financial holds, attendance patterns, and engagement signals - and proactively reach out before small problems become reasons to drop out.[7]
What Meaningful Data Looks Like in Practice
What follows is a live example from the ShineQuo Admin Portal, which aggregates student engagement, community activity, and coaching session data into a unified dashboard for institutional leaders. The numbers below are drawn from a real pilot institution.

What this data reveals is not simply who logged in. It reveals what students are actively working on. The top discussion topics - energy management, self-confidence, emotional resilience - map almost exactly onto the dimensions of student flourishing that the Healthy Minds Study has identified as declining nationally. The most-accessed resources center on task management, career navigation for international students, and daily wellness habits.
This is the kind of institutional intelligence that helps student affairs teams allocate programming budgets, identify underserved populations, and make the case to senior leadership for investment in particular support modalities.
The Role of Qualitative Data: Hearing the Student Voice
Quantitative dashboards tell administrators what is happening. Qualitative feedback explains why it matters.
Research in learning analytics increasingly emphasizes the importance of combining behavioral data with student-reported experience. A 2025 study from Imperial College London published in JMIR Formative Research found that students are generally supportive of data use for well-being when it is transparent, student-centered, and tied to genuine support - not surveillance.[8]
The following are representative responses from students using coaching services through the portal, illustrating the kinds of qualitative signals that help institutions understand impact at a human level:
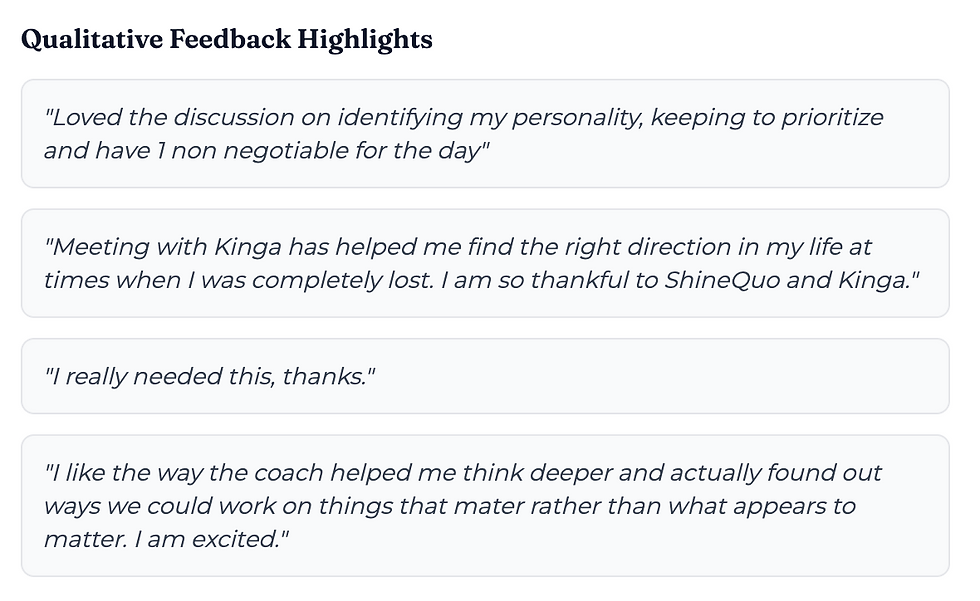
These responses are not outliers. They reflect a pattern: students who engage in structured coaching conversations - grounded in goal-setting, self-awareness, and habit formation - describe measurable shifts in clarity and motivation. When this qualitative data is surfaced alongside engagement metrics, it gives administrators a much richer basis for evaluating program effectiveness than attendance numbers alone.
AI-Assisted Interpretation: Moving from Observation to Recommendation
One of the most significant emerging applications of data in higher education is not just dashboards - it is AI-assisted pattern recognition that helps administrators identify what the data means and what to do about it.
A 2023 data analytics review in Intetics Education Research noted that the University of New England's Automated Wellness Engine - which analyzes behavioral and engagement signals to identify high-risk students - helped reduce dropout rates from 18% to 12% during its pilot period.[9] The key was not the volume of data, but the platform's ability to surface actionable signals in time for intervention.
What AI Insight Identifies | Why It Matters for Institutional Strategy |
High demand for executive functioning & time management | Suggests targeted programming in academic skills coaching and peer workshops; aligns with national data showing time management as a top student stressor |
Students attending multiple coaching sessions | Signals strong demand for structured, recurring support - not just one-off wellness events |
Engagement spikes around career readiness content | Indicates opportunity to integrate well-being into career services programming, especially for international students navigating employment uncertainty |
Low engagement among specific demographic segments | Surfaces equity gaps early, before they become retention problems - consistent with Active Minds and Healthy Minds research on disparities in help-seeking |
This kind of AI-assisted interpretation doesn't replace the judgment of student affairs professionals. It informs it - freeing up administrator time from manual report-reading and directing attention toward the students and programs that need it most.
The Budget Reality: Why Flexibility Matters for Smaller Institutions
Any honest conversation about data tools for higher education has to address a structural problem: most of the institutions that most need this kind of support are also the ones least able to afford rigid, enterprise-scale contracts.
The National Association of College and University Business Officers (NACUBO) flagged this explicitly in its 2025 Top Business Issues report, noting that small private colleges are disproportionately affected by shrinking enrollments and reduced revenue - facing funding pressures from nearly every direction simultaneously.[10] For community colleges and smaller regional institutions, even modest cuts in federal or state appropriations can force difficult choices between staffing, student services, and technology investment.
A report from The Pew Charitable Trusts (2025) documented how public colleges are being squeezed simultaneously by federal research funding cuts, enrollment declines, and state budget strain - with higher education functioning as what fiscal analysts call the "balance wheel" of state budgets, meaning it absorbs cuts first when revenues fall.[11]
⚠️ A Real Challenge for Institutional Partnerships Many third-party vendors offering student wellness platforms operate with rigid annual or multi-year contracts, structured for large universities. This creates a genuine barrier for smaller institutions - community colleges, regional four-year schools, HBCUs, and minority-serving institutions - that want access to data tools but cannot commit to fixed, high-dollar contracts when their own budgets are unpredictable. A key question for any institution evaluating a wellness platform is: Does this vendor offer payment models that flex with our enrollment and fiscal cycle? |
A Center on Budget and Policy Priorities report made the stakes particularly clear for under-resourced institutions: smaller regional schools and minority-serving institutions face a compounded disadvantage - not only do they have fewer resources, but they also have "limited ability to collect, manage, and make institutional changes based on data" due to those financial constraints.[12]
This is why flexible credit management and budget-aligned pricing are not just nice-to-have features for a wellness platform - they are a prerequisite for meaningful access. The institutions serving the most at-risk student populations often have the least financial margin for error.
What Institutions Should Look for in a Student Data Platform
Based on the research literature and practitioner conversations, here is a working framework for evaluating any student engagement or wellness data platform:
Capability | What to Ask the Vendor |
Qualitative + quantitative | Does it surface student voices alongside engagement metrics, or only behavioral data? |
HIPAA / FERPA compliance | Is all data aggregated and anonymized at the dashboard level? Can individual student responses be traced? |
Campus resource integration | Can the platform surface your existing campus resources to students, rather than replacing them? |
Pricing flexibility | Does the vendor offer tiered or enrollment-based pricing? Can smaller institutions access the full feature set without enterprise-scale commitments? |
Growth measurement | Does the platform track student development over time - confidence, graduation readiness, career preparedness - not just participation counts? |
The Shift That Matters
Higher education is entering a period of heightened accountability. Institutions are being asked to demonstrate - not just describe - their impact on student success, well-being, and post-graduation outcomes. Accreditors, legislators, and increasingly students themselves want evidence, not anecdote.
Meeting that standard does not require a massive technology overhaul. It requires a clearer connection between the data institutions already generate and the decisions that institutions actually make. That connection is built through better interpretation, not just better collection.
The most important shift is not from paper reports to digital dashboards. It is from asking "What happened?" to asking "What should we do about it?" - and having the tools and institutional culture to follow through.
"The need for data-driven decision-making primarily motivates interest in analyzing data in higher education... the practical use of analytics can provide valuable insights for solving systemic challenges facing higher education in the twenty-first century." - Springer Education and Information Technologies, 2023 Systematic Review
Introducing the ShineQuo Admins Dashboard The Admins Dashboard was built in direct response to the challenges described in this article - bringing engagement analytics, community insights, qualitative feedback, and AI-assisted interpretation into a single, privacy-compliant dashboard. Designed for institutions of all sizes, with pricing that flexes to fit your budget cycle. |
Frequently Asked Questions (FAQs)
Why is it so hard for colleges to make sense of their own student data?
Because data lives in silos - counseling systems, LMS platforms, event attendance tools, and engagement apps each tell a partial story. Without a unified view, administrators see numbers but rarely the patterns that drive decisions.
What's the difference between tracking student engagement and measuring student well-being?
Engagement data shows what students are doing - logins, sessions, resource views. Well-being data shows how they're developing - confidence, sense of direction, graduation readiness. Both matter; neither alone is enough for real strategic decisions.
Does investing in student wellness programs actually improve retention?
Yes. A 2025 TimelyCare survey found 73% of students believe wellness support makes them more likely to graduate, and 68% reported that emotional difficulties had directly hurt their academic performance that month. Wellness investment is retention investment.
What are college students most struggling with right now?
The 2024–25 Healthy Minds Study (84,000+ students) found 37% reporting moderate-to-severe depression and 52% reporting high loneliness. At the day-to-day level, the top themes students seek support on are time management, self-confidence, and emotional resilience - practical skill-building, not just crisis care.
How can AI help student affairs teams act on data faster?
Instead of leaving administrators to manually interpret multiple dashboards, AI surfaces patterns automatically - identifying which student groups are underserved, which support areas are most in demand, and what to prioritize next. Platforms like ShineQuo embed this directly into the admin view so the question shifts from "what does this data mean?" to "what do we do next?"
Should qualitative student feedback be part of our data strategy?
Absolutely. Numbers show reach; student voices show impact. When a student says "coaching helped me find direction when I was completely lost," that is institutional evidence - the kind that resonates in board rooms and accreditation reviews in a way that login rates simply don't.
Can a third-party platform work alongside our existing campus resources?
It should. The best platforms - including ShineQuo - are designed to surface your existing campus resources directly to students, so the platform amplifies what you already have rather than competing with it or requiring students to navigate somewhere new.
Are student wellness platforms accessible for smaller colleges with tight budgets?
Not always - most enterprise platforms are priced for large universities, which effectively locks out community colleges, smaller regional institutions, and HBCUs. ShineQuo's model is designed around flexible, enrollment-based pricing so institutions can access the full feature set without committing to a rigid multi-year contract.
Is student data on a wellness platform HIPAA and FERPA compliant?
It must be - always verify before deploying. At the institutional dashboard level, all data should be aggregated and anonymized; individual student responses should never be identifiable by administrators. Ask any vendor for their Business Associate Agreement and data deletion policy before signing.
How do we make the case to senior leadership for a student data platform?
Lead with the cost of attrition, not the cost of the platform. Every student who stops out represents significant lost tuition revenue - typically far more than the cost of the support investment. Provosts in the most recent Inside Higher Ed survey ranked mental health as the #1 threat to student safety and institutional success. Frame it as risk management, not a line item.
References & Further Reading
[1] Healthy Minds Network. Healthy Minds Study: 2024–2025 National Data Report. University of Michigan School of Public Health. healthymindsnetwork.org
[2] Ezarik, M. "College Student Mental Health Remains a Wicked Problem." Inside Higher Ed, October 30, 2025. insidehighered.com
[3] "Mental Health Services Can Help Keep Students on Track to Graduate." Inside Higher Ed / TimelyCare, January 14, 2025. insidehighered.com
[4] Active Minds & TimelyCare. "New Data Emphasizes the Correlation Between Loneliness and Student Mental Health." Press release, May 22, 2024. activeminds.org
[5] Mogaji, E., et al. "A Decade of Research into the Application of Big Data and Analytics in Higher Education." Education and Information Technologies, Springer Nature, July 2023. link.springer.com
[6] Tsilifis, P., et al. "Optimising Data Analytics to Enhance Postgraduate Student Academic Achievement: A Systematic Review." Education Sciences, MDPI, 14(11), November 2024. mdpi.com
[7] "Higher Education Turns to Data Analytics to Bolster Student Success." EdTech Magazine, October 2021. edtechmagazine.com
[8] Freccero, A., et al. "Students' Perceptions of Learning Analytics for Mental Health Support: Qualitative Study." JMIR Formative Research, Imperial College London, August 2025. pmc.ncbi.nlm.nih.gov
[9] "Data Analytics in Education: 8 Strategies for Success." Intetics, May 2023. intetics.com
[10] NACUBO. State of Higher Education: Top 5 Business Issues of 2025. National Association of College and University Business Officers. nacubo.org
[11] Forrest, P., Judd, R., & Pittman, S. "Higher Education's Uncertain Fiscal Future." The Pew Charitable Trusts, November 2025. pew.org
[12] Leachman, M., et al. "State Higher Education Funding Cuts Have Pushed Costs to Students, Worsened Inequality." Center on Budget and Policy Priorities. cbpp.org


Comments